Data Tables
bs.TableView is bootstack's high-density tabular widget. It pairs a built-in
toolbar (search, export), a sortable header, paginated rows, and an optional
status footer with a SQLite-backed datasource that handles filtering, sorting,
and pagination behind the scenes.
This guide shows how to wire data into a TableView, control what users can do with it, and shape the values that appear in cells. The companion DataSource guide covers the data layer itself; this guide is about the widget.
Quick start
The simplest way to populate a TableView is with columns + rows. TableView
creates an in-memory SQLite datasource for you.
import bootstack as bs

app = bs.App(title="Readings", minsize=(720, 360))

bs.TableView(
    app,
    columns=[
        {"text": "ID",      "width": 90},
        {"text": "Channel", "width": 90,  "anchor": "center"},
        {"text": "Reading", "width": 100, "anchor": "e"},
        {"text": "Status",  "width": 100, "anchor": "center"},
    ],
    rows=[
        ("R-1042", "CH-1", "1.0438", "Pass"),
        ("R-1043", "CH-2", "0.8794", "Warning"),
        ("R-1044", "CH-3", "1.2104", "Pass"),
        ("R-1045", "CH-4", "2.1583", "Fail"),
    ],
    page_size=25,
).pack(fill="both", expand=True, padx=12, pady=12)

app.mainloop()
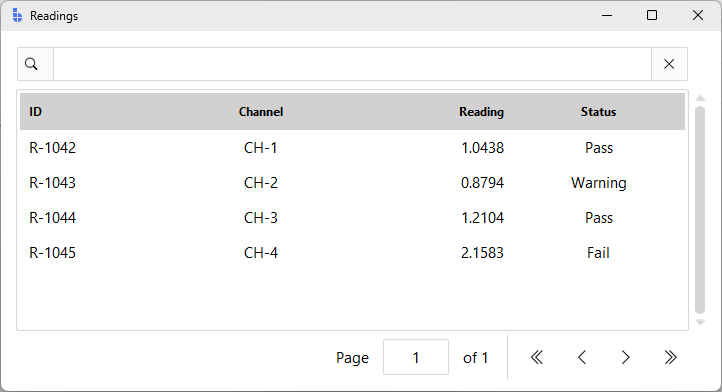
Out of the box you get: clickable column headers (sort), a search box, a header context menu (filter/group/hide), pagination buttons, and a status footer.
Columns
columns= accepts a list of strings or a list of dicts. Strings give you a
column name and nothing else; dicts let you control width, alignment, and how
the column maps onto the underlying record key.
bs.TableView(
    parent,
    columns=[
        {"text": "ID",        "key": "id",        "width": 90},
        {"text": "Run",       "key": "run",       "width": 110},
        {"text": "Timestamp", "key": "ts",        "width": 160},
        {"text": "Channel",   "key": "channel",   "width": 80,  "anchor": "center"},
        {"text": "Reading",   "key": "reading",   "width": 100, "anchor": "e"},
        {"text": "Δ",         "key": "delta",     "width": 90,  "anchor": "e"},
        {"text": "Status",    "key": "status",    "width": 110, "anchor": "center", "stretch": True},
    ],
    rows=records,
)
| Key | Purpose |
|---|---|
text |
Heading shown in the column header |
key |
Field name in the underlying record (defaults to text) |
width |
Initial pixel width |
anchor / align |
Text alignment: "w", "center", "e" |
stretch |
Whether the column expands when the table is resized |
dtype |
Storage hint ("INTEGER", "REAL", "TEXT"); affects default alignment |
If you omit the dtype, TableView samples the first page and right-aligns
columns whose values parse as numbers. Override with anchor when needed.
Provide explicit key values when headers aren't plain identifiers
When key is omitted, the column text is used as the SQLite column name.
This is fine for simple headers like "Channel" or "Status", but causes
a silent empty-table failure for headers containing spaces or special
characters — "Temp °C" and "|Δ|" are examples. It also matters when
you pass filter SQL via set_filters(): the key is the name you use in
the WHERE clause, so an explicit key keeps that predictable.
Use short alphanumeric keys: "run_id", "channel", "temp".
Tuple rows vs dict rows
When rows is a list of tuples, the position-to-column mapping comes from the
order of columns. When rows is a list of dicts, each column's key selects
the field. Dict rows are easier to keep in sync as schemas grow:
records = [
    {"id": "R-1042", "channel": "CH-1", "reading": 1.0438, "status": "Pass"},
    {"id": "R-1043", "channel": "CH-2", "reading": 0.8794, "status": "Warning"},
]

bs.TableView(parent, columns=columns, rows=records)
Wiring to a DataSource
For anything beyond a quick demo, build the datasource yourself and pass it as
datasource=. TableView is specifically backed by SqliteDataSource —
in-memory for a working buffer, or pointed at a file for persistence.
from bootstack.datasource import SqliteDataSource

ds = SqliteDataSource(":memory:", page_size=50)
ds.set_data(records)

tv = bs.TableView(
    parent,
    columns=columns,
    datasource=ds,
    page_size=50,
)
Other DataSource implementations (MemoryDataSource, FileDataSource) don't
plug into TableView directly — they expect different storage. To use a CSV file
with TableView, load it via FileDataSource and hand the records to TableView:
from bootstack.datasource import FileDataSource

loader = FileDataSource("readings.csv", page_size=10_000)
loader.load()
all_records = loader.get_page_from_index(0, loader.total_count())

bs.TableView(parent, columns=columns, rows=all_records)
For richer record shapes (lists, hierarchical data) use ListView
or TreeView instead — both accept any
DataSourceProtocol implementation.
Refreshing data
Call set_data(rows) to replace the contents of the table. The current page
resets to 0 and any active filter/sort is preserved:
def reload():
    fresh = fetch_records_from_api()
    tv.set_data(fresh)

bs.Button(parent, text="Refresh", icon="arrow-clockwise", command=reload).pack()
Selection
selection_mode controls how rows can be selected:
"none"— disabled (table is read-only display)"single"— one row at a time (default)"multi"— multiple rows; clicking with Ctrl/Shift extends the selection
Read the current selection via selected_rows:
tv = bs.TableView(
    parent,
    columns=columns,
    rows=records,
    selection_mode="multi",
    allow_select_all=True,
)

def show_selection(_evt):
    rows = tv.selected_rows  # list[dict] of full records
    print(f"{len(rows)} selected")

tv.on_selection_changed(show_selection)
Other selection helpers:
tv.select_rows([iid, ...])— select rows by internal idtv.deselect_all()— clear the selectiontv.select_all()/tv.deselect_all()— bulk operationstv.scroll_to_row(iid)— bring a row into view
The iid strings come from event payloads (event.data["iid"]) — opaque
handles for the lifetime of the current page.
Sorting and filtering
Column headers are clickable: a click toggles ascending/descending sort on that column. The active sort indicator appears in the header. Right-clicking a header opens a context menu with Filter, Group by, Hide column, and related actions; right-clicking a row offers Filter by this value as a shortcut.
Programmatic control:
tv.set_sorting("reading", ascending=False)
tv.clear_sorting()

tv.set_filters("status = 'Fail' OR delta > 0.1")
tv.clear_filters()

tv.set_grouping("channel")
tv.clear_grouping()
The filter syntax is the same SQL-like dialect used everywhere in the DataSource layer — see DataSource → Filtering for the operator reference.
The built-in search box (top-left of the toolbar) runs a substring match across all columns. Switch to advanced mode for explicit comparators:
bs.TableView(
    parent,
    columns=columns,
    rows=records,
    enable_search=True,
    search_mode="advanced",   # adds an EQUALS / CONTAINS / SQL selector
    search_trigger="enter",   # or "input" for live search
)
To suppress the toolbar entirely, pass enable_search=False and
enable_filtering=False. The header and row context menus also disappear when
you set context_menus="none".
Pagination
TableView paginates by default. Use page_size to control how many rows
appear per page; the footer shows page navigation buttons and a row count.
tv = bs.TableView(
    parent,
    columns=columns,
    rows=records,
    page_size=25,
    show_table_status=True,    # row counts and filter/sort status
    show_vscrollbar=True,
)

# Programmatic navigation
tv.first_page()
tv.next_page()
tv.previous_page()
tv.last_page()
tv.go_to_page(3)
For very large datasets, virtual paging skips the page footer and scrolls continuously, fetching pages on demand:
tv = bs.TableView(
    parent,
    columns=columns,
    datasource=large_sqlite_source,
    paging_mode="virtual",
    page_size=200,             # rows per fetch, not per page
    show_vscrollbar=True,
)
To hide pagination UI on small datasets — as the demo app's Results page does
because all 16 rows fit on one screen — combine show_table_status=False with
a page_size larger than the dataset:
bs.TableView(
    parent,
    columns=columns,
    rows=results,
    show_table_status=False,
    page_size=len(results),
)
Formatting cell values
Unlike input widgets, TableView does not have a value_format= parameter on
columns. Cells display whatever string representation the underlying values
have. To control how numbers and dates appear, format them when you build the
records:
from datetime import datetime
from babel.numbers import format_decimal
from babel.dates import format_datetime

def format_record(raw):
    return {
        "id": raw["id"],
        "channel": raw["channel"],
        "reading": format_decimal(raw["reading"], format="0.0000"),
        "delta":   format_decimal(raw["delta"],   format="+0.0000;-0.0000"),
        "ts":      format_datetime(raw["ts"], "yyyy-MM-dd HH:mm"),
        "status":  raw["status"],
    }

records = [format_record(r) for r in raw_results]
bs.TableView(parent, columns=columns, rows=records)
The patterns are the same ones the Formatting guide documents for input widgets — just applied to the data instead of the widget. Centralize the formatter so the same record shape feeds the table, an export, and any inline edit form.
Status indication
TableView renders cells as plain text — there is no per-cell renderer hook for inline badges. Three patterns work in practice:
- Decorate the status string with a unicode glyph or short label that
carries enough meaning on its own:
STATUS_TEXT = {"Pass": "✓ Pass", "Warning": "⚠ Warning", "Fail": "✗ Fail"} record["status"] = STATUS_TEXT[record["status"]] - Show the count, not the row. When users only need to know how many
are failing, render a status banner above the table and keep the cells
plain. See the demo app's Results footer (
{n} records) for the pattern. - Drop to
bs.TreeViewwhen you genuinely need per-row coloring. TreeView'stag_configurelets you map status values to background colors — it lacks TableView's toolbar and pagination, but it scales well for small dashboards. See TreeView and Color & Theming for the available tokens.
Editing and exporting
Pass enable_adding, enable_editing, and enable_deleting to surface a
toolbar add button, double-click-to-edit on rows, and a row-context-menu
delete. Edits open an automatically-generated bs.FormDialog whose fields are
inferred from the column definitions:
tv = bs.TableView(
    parent,
    columns=columns,
    rows=records,
    enable_adding=True,
    enable_editing=True,
    enable_deleting=True,
    selection_mode="multi",
)

tv.on_row_inserted(lambda e: print("inserted:", e.data["records"]))
tv.on_row_updated (lambda e: print("updated:",  e.data["records"]))
tv.on_row_deleted (lambda e: print("deleted:",  e.data["records"]))
Export adds a download icon to the toolbar:
bs.TableView(
    parent,
    columns=columns,
    rows=records,
    enable_exporting=True,
    export_scope="all",            # or "page" for just the current page
    export_formats=("csv", "json"),
    allow_export_selection=True,   # menu entry for "Export selection"
)
Worked example: results browser
This mirrors the Results page in the Data Analysis Workbench demo
(docs_scripts/demo_app.py). It renders cross-run readings with a filter
toolbar above and an export footer below.
import bootstack as bs
from bootstack.constants import BOTH, LEFT, RIGHT, X, YES, N

RESULTS = [
    ("R-1042", "Run-A12", "2026-05-04 09:12", "CH-1", "1.0438", "V", "0.0021", "23.4", "Pass"),
    ("R-1043", "Run-A12", "2026-05-04 09:12", "CH-2", "0.8794", "V", "0.0143", "23.5", "Warning"),
    ("R-1044", "Run-A12", "2026-05-04 09:13", "CH-3", "1.2104", "V", "0.0312", "23.4", "Pass"),
    ("R-1045", "Run-A12", "2026-05-04 09:13", "CH-4", "2.1583", "V", "0.4821", "23.6", "Fail"),
    ("R-1046", "Run-A13", "2026-05-04 10:02", "CH-1", "1.0451", "V", "0.0013", "22.9", "Pass"),
    ("R-1047", "Run-A13", "2026-05-04 10:02", "CH-2", "0.8902", "V", "0.0108", "22.8", "Warning"),
]

COLUMNS = [
    {"text": "ID",        "key": "run_id",  "width": 90},
    {"text": "Run",       "key": "run",     "width": 100},
    {"text": "Timestamp", "key": "ts",      "width": 150},
    {"text": "Channel",   "key": "channel", "width": 80,  "anchor": "center"},
    {"text": "Reading",   "key": "reading", "width": 100, "anchor": "e"},
    {"text": "Unit",      "key": "unit",    "width": 60,  "anchor": "center"},
    {"text": "|Δ|",       "key": "delta",   "width": 90,  "anchor": "e"},
    {"text": "Temp °C",   "key": "temp",    "width": 90,  "anchor": "e"},
    {"text": "Status",    "key": "status",  "width": 110, "anchor": "center", "stretch": True},
]

app = bs.App(title="Results", minsize=(1100, 540))

# --- Filter toolbar ---------------------------------------------------------
filters = bs.LabelFrame(app, text="Filters", padding=12)
filters.pack(fill=X, padx=20, pady=(20, 12))

fbar = bs.PackFrame(filters, direction="horizontal", gap=8, anchor_items=N)
fbar.pack(fill=X)

search = bs.TextEntry(fbar, label="Search", message="Sample ID, run, channel…")
search.pack(fill=X, expand=YES)

status = bs.SelectBox(
    fbar, label="Status",
    items=["All", "Pass", "Warning", "Fail"], value="All",
)
status.pack()

# --- Table ------------------------------------------------------------------
table_frame = bs.LabelFrame(app, text="Readings", padding=10)
table_frame.pack(fill=BOTH, expand=YES, padx=20, pady=(0, 8))

tv = bs.TableView(
    table_frame,
    columns=COLUMNS,
    rows=RESULTS,
    striped=True,
    enable_filtering=False,    # use external filter toolbar instead
    enable_search=False,
    show_table_status=False,
    page_size=len(RESULTS),
)
tv.pack(fill=BOTH, expand=YES)

# --- Apply external filters --------------------------------------------------
def apply_filters(_evt=None):
    clauses = []
    if (q := search.get().strip()):
        q = q.replace("'", "''")
        clauses.append(
            f"(run_id LIKE '%{q}%' OR run LIKE '%{q}%' OR channel LIKE '%{q}%')"
        )
    if (s := status.get()) and s != "All":
        clauses.append(f"status = '{s}'")
    tv.set_filters(" AND ".join(clauses) if clauses else "")

search.on_input(apply_filters)
status.bind("<<Change>>", apply_filters, add=True)

# --- Footer -----------------------------------------------------------------
footer = bs.Frame(app)
footer.pack(fill=X, padx=20, pady=(0, 20))
bs.Label(
    footer, text=f"{len(RESULTS)} records", font="body", accent="secondary",
).pack(side=LEFT)
bs.Button(
    footer, text="Export", icon="download", accent="secondary",
    variant="outline", command=lambda: None,
).pack(side=RIGHT)

app.mainloop()
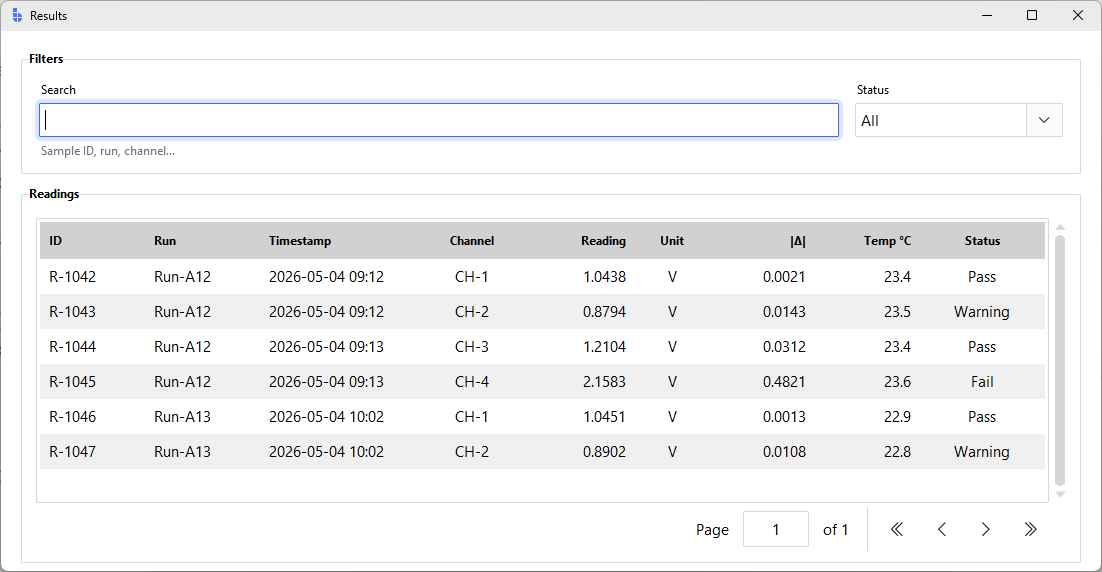
Two things worth noting in this example:
- The TableView's built-in toolbar is suppressed (
enable_search=False,enable_filtering=False,show_table_status=False) because the page presents an external filter toolbar that styles the controls more richly. Filters are then applied viatv.set_filters(where_sql). - Filter values are escaped with
q.replace("'", "''")before being interpolated into the SQL. The DataSource layer accepts awherestring, not parameterised queries — sanitize anything that comes from the user.
Common pitfalls
- Headers with spaces or special characters need an explicit
key. Whenkeyis omitted, the columntextis used as the SQLite column name. Headers like"Temp °C"or"|Δ|"produce invalid SQL identifiers and cause a silent empty-table failure. Use a plain alphanumerickeyfor any column whose header isn't a simple word. datasource=requiresSqliteDataSource. The widget reads SQLite metadata for column-type inference, soMemoryDataSourceandFileDataSourcedon't plug in directly. Userows=for one-shot data, or preload via FileDataSource and hand the records to TableView.- No per-cell renderer. Columns don't accept a
formatter=callback or avalue_format=token like input widgets do. Format your records before loading; see Formatting for the patterns. - Filter strings are SQL. They run against the underlying SQLite WHERE clause. A user-supplied filter must be escaped; the safer path is to build the clause programmatically from validated form fields rather than concatenating raw input.
reading > 1.0may not match text-stored numbers. SQLite stores values using the type SQLite inferred from the first row. If a column's first value was a string, comparisons coerce inconsistently. Setdtype="REAL"ordtype="INTEGER"on the column to force numeric storage.- Hidden toolbar still gets keyboard events. When
enable_search=False, Ctrl+F has no target. Bind your own search shortcut to the external entry if you suppress the toolbar.
Related
- DataSource — filter syntax, sorting, custom backends
- Formatting — number, date, and time format patterns
- TableView — full parameter reference
- TreeView — hierarchical data and per-row tag coloring
- ListView — virtual scrolling for list-shaped (non-tabular) data
- Color & Theming — accent and surface tokens for status indication