Displaying Data#
This guide covers the widgets that show data: single values, flat lists,
tabular grids, and hierarchies. The three collection widgets —
ListView, DataTable, and
Tree — share one model: you hand them records (plain
dicts), and they hand back the selected records through one universal
.selection accessor.
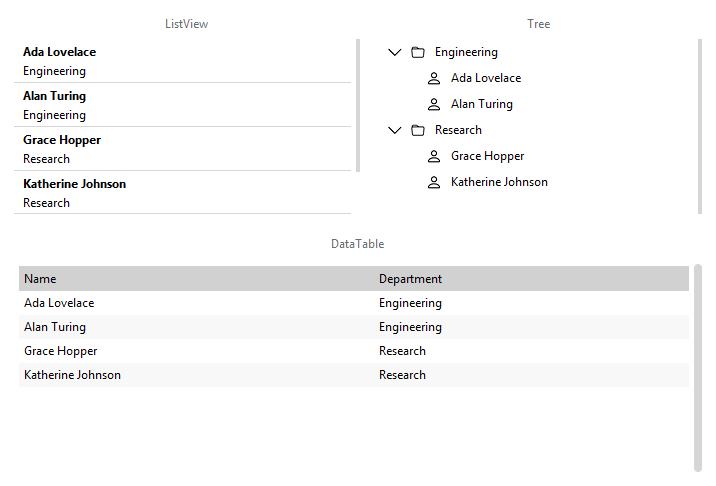
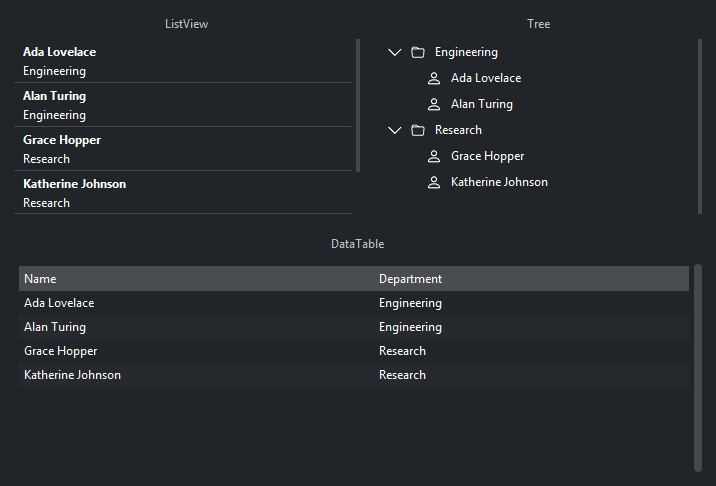
The same records, shown three ways — a flat list, a sortable grid, and a hierarchy grouped by department:
Single values#
Label shows a line of text. Badge shows a
short colored label — a count, or a status word like New or Overdue. Bind
either to a Signal and it updates whenever that signal’s value
changes:
count = bs.Signal(0)
bs.Label(textsignal=count.map(lambda n: f"{n} unread"), font="heading-md")
bs.Badge("New", accent="success")
Lists#
ListView shows a scrolling list of records. Pass items= a
list of dicts; the title, text, icon, and badge keys are rendered, and
any other keys ride along as data you get back on selection. Set
selection_mode= to make rows selectable:
people = [
    {"id": 1, "title": "Ada Lovelace", "text": "Engineering", "role": "lead"},
    {"id": 2, "title": "Alan Turing", "text": "Research", "role": "staff"},
]
view = bs.ListView(items=people, selection_mode="single")
view.on_select(lambda e: print(view.selection))   # {"id": 1, "title": ..., "role": "lead"}
What .selection returns depends on the selection mode: in "single" mode it is
one record dict (or None); in "multi" mode it is a list of dicts. To change
the selection from code, call select_items(ids) or deselect_items(ids).
Tables#
DataTable is the columnar grid. Give it rows= (a list of
dicts) and columns= — either bare key names or ColumnSpec dicts for headers, widths, alignment, and display
formatting:
bs.DataTable(
    columns=[
        {"key": "name", "text": "Name", "width": 160},
        {"key": "salary", "text": "Salary", "width": 110, "anchor": "e", "format": "${:,.0f}"},
        {"key": "dept", "text": "Department", "width": 140},
    ],
    rows=[
        {"id": 1, "name": "Ada", "salary": 95000, "dept": "Engineering"},
        {"id": 2, "name": "Alan", "salary": 88000, "dept": "Research"},
    ],
)
DataTable defaults to selection_mode="single", so .selection is one dict
(or None).
Search and column sorting are built in. Export is opt-in: pass allow_export=True
and export_formats=["csv", "xlsx"] for a user-facing export button, or call
table.to_csv() or table.export_file(path) from code.
Trees#
Tree shows a hierarchy. Build it declaratively with nodes=,
or — far more common with real data — bind a flat table and let the tree
assemble the hierarchy from a parent reference on each row:
from bootstack.data import MemoryDataSource

src = MemoryDataSource().load([
    {"id": 1, "parent_id": None, "name": "Documents"},
    {"id": 2, "parent_id": 1, "name": "Reports"},
    {"id": 3, "parent_id": 1, "name": "Invoices"},
    {"id": 4, "parent_id": 2, "name": "Q1.pdf"},
])

tree = bs.Tree(data_source=src, parent_field="parent_id", label_field="name")
tree.on_select(lambda e: print(tree.selection))   # a TreeNode (single mode)
A tree’s .selection returns TreeNode handles rather than
plain dicts; each node’s record is at node.data. Use tree.find(...) /
tree.find_all(...) to locate nodes by predicate — on a data-source-backed tree,
a col(...) condition even reaches branches that have not been expanded yet.
Backing a widget with a data source#
The items=/rows= shortcuts above copy a static list. For data that changes —
that you filter, sort, page, or edit — back the widget with a data source
instead, and pass it as data_source=. The widget refreshes automatically when
the source changes:
from bootstack.data import MemoryDataSource, col

src = MemoryDataSource().load(people)
src.where(col("role") == "lead")    # filter
src.order("-salary")                # sort, descending

bs.DataTable(data_source=src, columns=["name", "salary", "dept"])
All sources share one interface, so the widget code never changes when you switch
between them. MemoryDataSource keeps records in memory;
SqliteDataSource is file-backed, for large or persistent
data; FileDataSource reads CSV, Parquet, and similar files.
One source can back several widgets at once. An insert, update, or delete on
it then refreshes every view bound to it.
The filter and sort DSL (col, any_of, all_of), paging, and live observation
are covered in Data Sources.
See also#
Data Sources — sources, the query DSL, paging, live updates.
ListView · DataTable · Tree — the collection-widget reference pages.
Handling Actions — responding to selection and row events.